Cross Sectional Study of Pain Management Practice at Medical Wards of Jimma University Specialized Hospital (JUSH), Southwest Ethiopia
Zenawi Negash, Sahilu Assegid, Cherinet Abebe
Zenawi Negash1*, Sahilu Assegid2, Cherinet Abebe2
Department of Internal medicine Jimma University, Ethiopia
Department of Epidemiology, Jimma University, Ethiopia
- Corresponding Author:
- Sahilu Assegid, MD, MPH
Associate professor of Epidemiology
Jimma University, Ethiopia
Tel: +251 471 110331
E-mail: sahiluassegid@yahoo.com
Received Date: September 10, 2015; Accepted Date: November 24, 2015; Published Date: December 03, 2015
Abstract
Background: Data on the practice of assessment and management of pain at medical ward of JUSH is scant.
Objective: To examine the state of assessment and management of pain at JUSH medical wards.
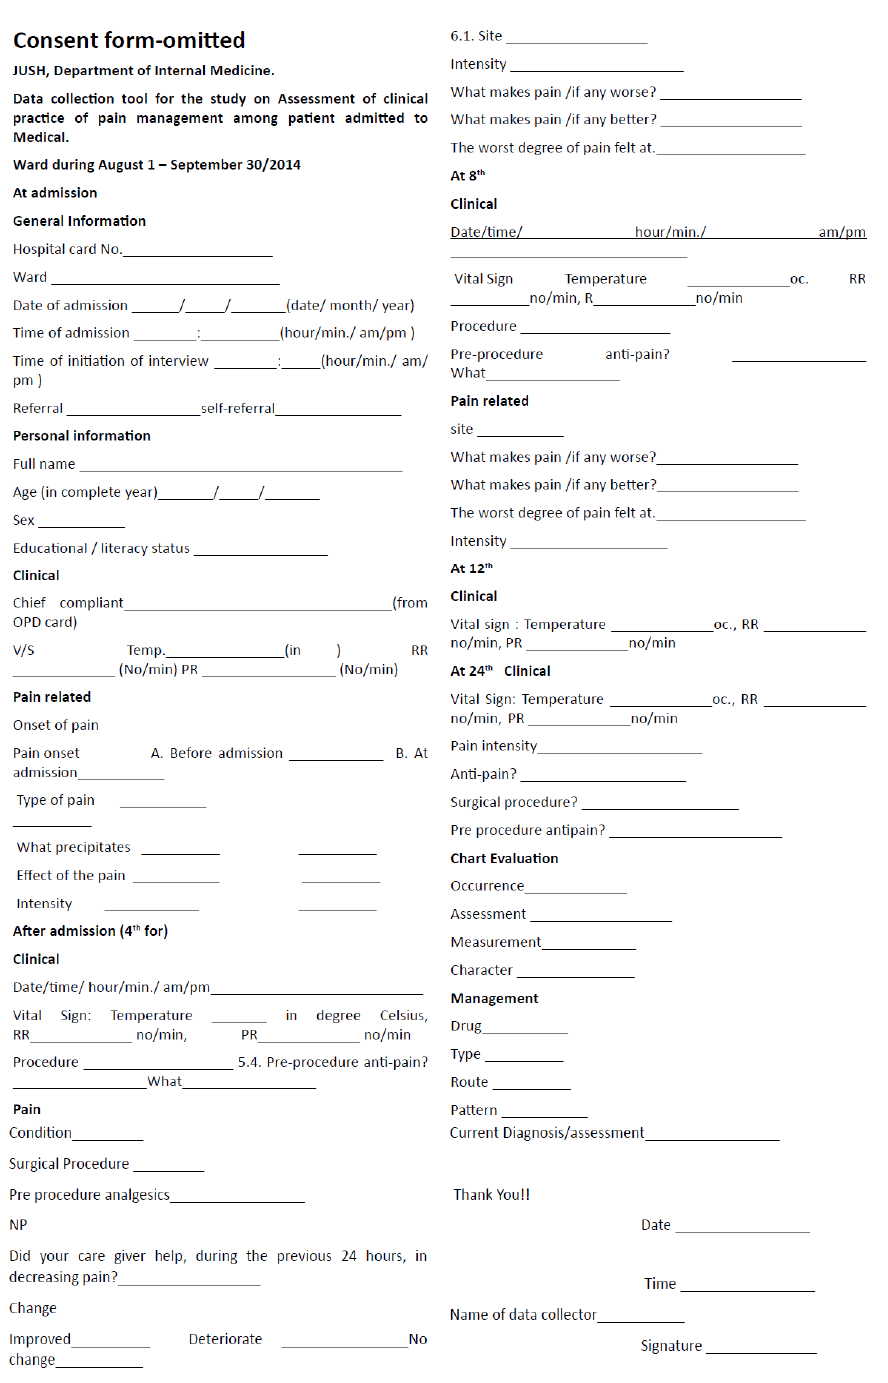
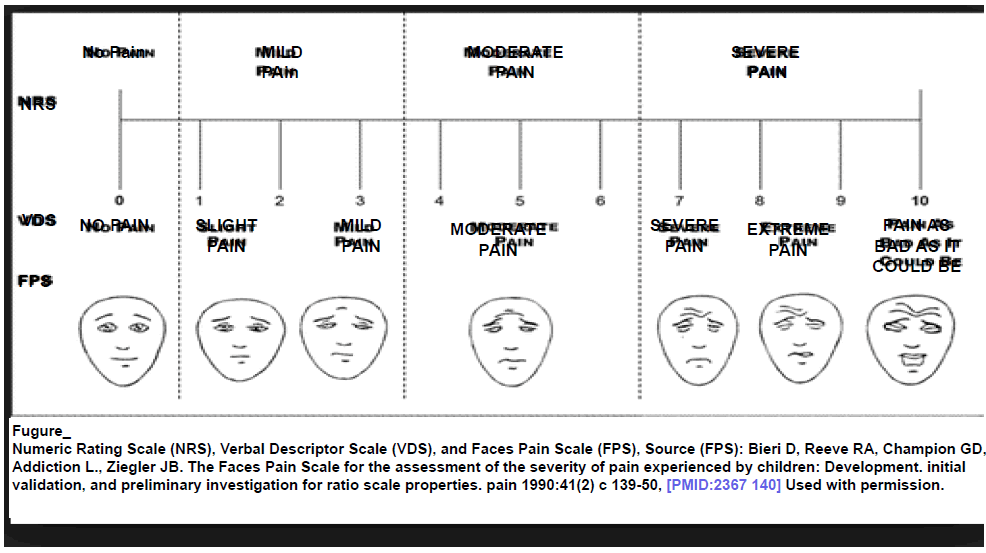
Materials and Methods: A cross sectional study was conducted to evaluate the assessment and management of pain at JUSH medical wards from August 1-September 30/2014 GC. A total of 161 patients were included. Data was collected using interview and observation. Information about sociodemographic variables and about pain- collected through independent scoring of pain, and characterization of pain at admission, 4th hr, 8th hour 12th and 24th hr of their admission time using FPS (Facial Pain Scale) which was later categorized as: no, mild, moderate and severe pain if it falls at 0, 1-3, 5-7, and 8-10 respectively. Finally, individual patient’s chart review was done. For the purpose of this study 9 data collectors were recruited and trained. Supervision was conducted during data collection. Data was analyzed using SPSS 20. Ethical clearance was obtained from the ethical committee of College of Public Health and Medical Science (CPHMS).
Results: From a total 195 admitted patients over 55 days, 161 patients who fulfilled the inclusion criteria were included in the study. The mean age (SD) was 49.89 (1.60) years, 29 (18.01%) were aged 65 or more and age ranges 19-84. About 69(42.8%) were females. The mean age (SD) of females and males was 42.99 (13.51) and 55.08 (15.10) years respectively. Before admission, 45 (28.30%), 80 (50.31%), and 22 (13.83%) had mild, moderate and severe pain respectively. At admission, 54 (33.96%), 88 (55.34%), and 4(2.51%) had mild moderate and severe pain respectively. After admission, 113 (%), 29(%) and 1 (%) had mild, moderate and severe pain respectively. About 80 (49.69%) and 51 (31.68%) of patients felt the worst degree of pain before and at admission respectively. Concerning the effect of pain, 71 (48.63%), 43(29.45%), and 23 (15.75%) of patients who experienced pain expressed that the pain interfered with their sleep, physical activity, and mood respectively. Pain aggravating conditions mentioned at 8th hour were IV/IM/IM medication, LP/ID/catheter. At 24th hr, 43 (26.71%) of the patients both received analgesics their pain assessment and management documented, among these, 17 (39.53%) and 27 (62.79%) of drugs were ordered on regular and irregular basis respectively. The most commonly ordered drugs were diclofenac, paracetamol, and multiple, accounting for 21 (48.84%), 18 (41.8%), 4 (9.30%) respectively. Also six (3.73%) of all patients received analgesics as well as assessment and management of pain documented, and 12 (7.45%) patients’ assessment and management was documented without the patient’s receipt of analgesics. And 100 (62.11%) of patents neither received analgesics nor their assessment of pain/management documented. Pain was not measured using scales or ratings at all.
Keywords
Pain; Measurement; Jimma hospital
Introduction
Assessment of pain include about issues of temporal pattern, location, description, intensity, aggravating and relieving factors, previous treatment and effect [1]. Interventions for pain must be tailored to each individual with the goal of preempting chronic pain and relieving breakthrough pain [2].
A hospital-based cross-sectional study to assess drug related problems(DRP) conducted at JUSH from February 2011 to March 2011 at medical ward showed that out of 257 study participants, 189 (73.5%) had DRPs. From the six classes of DRPs studied, 103 (32.6%) cases related to untreated indication or need additional drug therapy, and 49 (15.5%) cases related to high medication dosage. Unnecessary drug therapy in 49 (15.5%) cases, low medication dosage in 44 (13.9%) cases, and ineffective drug therapy in 42 (13.3%) cases were the other classes of problems identified. Noncompliance in 31 (9.8%) cases was the least prevalent DRP. The study concluded that drug-related problems were common among medical ward patients. Also, indicationrelated problems, untreated indication and unnecessary drug therapy were the most common types of DRPs among patients of medical ward [3].
A prospective cross sectional study conducted among 252 postoperative patients during February 13 to April 30, 2012, at surgical ward of JUSH showed that incidence of postoperative pain was 91.4%, and remained high over 3 measurements, 80.1% of the patients were undertreated, 50% of the patients were adequately satisfied with their pain management. As needed (prn), solo analgesic, null analgesic, and intramuscular orders were noted for 31.3%, 89.29%, 9.7% and 20.1% of the prescription orders respectively. Diclofenac and tramadol were the top prescribed medications, and only 57% of their dose was administered. It was concluded “Despite patients’ paradoxical high satisfaction with pain management, the majority of patients were inadequately and inappropriately treated. Thus, further research is needed to determine how best to break down current barriers to effective pain management” [4].
A VISITING LECTURER PROGRAMME with key aims to develop and introduce a guideline for the management of pain was carried out from August-October 2012. Specific guidelines for pain management were designed for JUSH and introduced to all surgical wards, ICU and to the nursing staff, interns and residents running these areas. This was preceded by a number of teaching sessions involving over 150 staff on issues surrounding pain management and its importance. This teaching received feedback from trainees, such as: the need for further training and education in pain management, that the guideline will require follow -up training, and the need for updates for staff that have already been trained by successive visiting lecturer [5].
A record-review of 302 patient cards to assess the quality use analgesics in dental out patient in Jimma University Specialized Hospital, conducted from 22/01/2013-27/01/2013 showed that the most commonly prescribed non-opioid analgesic was diclofenac (43%) followed by paracetamol (36%) and concluded that the prescription analysis demonstrated that pain was neglected and the analgesics available are irrationally used [6].
In A cross-sectional survey was conducted among 2013 graduating-class students of medical and paramedical students of Jimma University concluded “Unacceptable level of knowledge deficits and poor attitudes were distinguished in this study which augments the universal concern of inadequate knowledge and attitudes regarding pain management. The study also recommended that the situation demands various educational and quality improvement initiatives in pain management [7-9].
Materials and Methods
A cross-sectional study to assess pain management practice among patients admitted to medical ward of JUSH was conducted from Aug 1, 2014-Sep 30, 2014. Situated at 350 km to the southwest of Addis Ababa, and is the only referral hospital for South Western Ethiopia. With a catchment population of approximately 15 million people, it provides services for approximately 90,000 patients every year. JUSH has 450 beds [7]. Medical ward has 81 beds (medical A, B and C have 32, 40 and 9 beds respectively).
All patients admitted to the ward during the study period were considered for study and, among them, 161 patients who full filled the inclusion criteria were selected as study subjects. The technique was interview of patients and observation (measurement of vital sign, pain assessment and chart review). Independent assessment of pain at set times was conducted using standard tool for assessment of clinical practice of pain management, pain (onset, type, intensity, worst), pain aggravating conditions, non-pharmacological management of pain. Finally review of patient chart was done. The quantitative variables were age (measured to nearest year), temperature, respiratory rate, pulse rate (measured in in number per minute). The qualitative variables were sex, literacy, chief compliant, pain, pain aggravating conditions, non-pharmacological management of pain and analgesics (type, dose, pattern and route).
Inclusion criteria
Patients who are conscious, able to communicate and willing to participate in the study.
Exclusion criteria
Readmissions, transfer and referral outside Jimma zone.
Data collectors
Nine data collectors who were known to take annual leave (two years) for the purpose of his study (because of duty Rota matched the beginning of data collection) were recruited. Also their linguistic proficiency and experience were considered.
Data collection
Began on August 1, 2014, 8:00 pm and ended Sep 30, 2014 5:00 pm
Each included patients was followed for 24 hrs from the time of admission. Information was collected from each patient at set times: at admission 4th, 8th, 12th and 24th hr from the time of their admission using the schedule:
At admission
Ensure fulfillment of inclusion criteria, time/date/month/YY/AM/ PM of admission, personal information, chief complaint, V/S, enquiry about pain that occurred before admission (experience, onset, type, intensity, duration, effect), and pain at admission.
At 4th hr
Time/date/month/YY/AM/PM, V/S, direct assessment of pain and pain aggravating conditions
At 8th hr
Time/date/month/YY/AM/PM, V/S, direct assessment of pain, and pain aggravating conditions
At 12th hr
Time/date/month/YY/AM/PM, V/S, direct assessment of pain, and pain aggravating conditions
At 24th hr
Time/date/month/YY/AM/PM, analgesic receipt, NP and
Chart Review
From each patient, a data collector ascertains receipt of analgesic (ordered, by patients request for prescription, or from outside sources) and the patient verify this by naming, identifying, or showing it. Data collector enquires about NP, reviews chart for written evidence about assessment of pain and management of pain.
Data Quality Control
Data collectors were freed from their regular work of assessment/management of patients. Training on objective, tools, measurement, patient inclusion, assessment of pain, ascertainment of analgesic, chart review and recoding were given. Similar thermometer and watch were used and supervision was conducted during data collection.
Data analysis
Results from patient interview, pain assessment and chart review was cleaned, coded and entered to computer using SPSS 20. Vital signs-temperature/RR/PR: measured and compared against standard normal for the same age and sex. Statistical summaries calculated for continuous variable intensity of pain categorized. Each patient was labeled as APMD, NAPMD, and IAPMD (defined below).
Ethical clearance was obtained from JUSH ethical committee of CPHMS and letter of cooperation was submitted for the hospital administration prior to data collection.
Operational Definition
Chief Compliant
Primal sign/symptom mentioned by patient, while at OPD, for which he/she sought the health care services. Patients with any two or more C/C are categorized “multiple”.
Before Admission
Refers to period of encompassing 24 hrs before the patient’s admission time.
At admission
Admission encompasses period 1 hour after admission time.
After admission
4th hr from time of admission.
Onset
Period when the pain start. Pain aggravating condition
Conditions that made the pain worse.
Pain-in-Sequence
Sequence of various levels of severity of pain (the first/before admission based on patient’s memory, second/at admission and third/after admission based on here and now).
Temporal Pattern of Pain
Frequency of its occurrence and change in intensity.
Worst degree of pain felt
Memorable moment when peak intensity of pain felt from among periods before, at, or after admission. Different periods with similar intensity and/or absence of pain are categorized separately.
Effect of Pain
Patient’s memorable failure in psychological, physical, social function believed by patients to have happened due to pain before admission. Multiple effects of pain and absence of are categorized as “others”.
Regularly ordered analgesic
Written document about analgesic that is to be administered at fixed interval and specific dose/analgesic.
Irregularly ordered analgesic
Written document about analgesic without clear/absence of fixed interval of administration.
Condition of analgesic order
Ordered by HP, through self-request or other.
Received pain medication (RPM)
Analgesics at the patient’s disposal/administered or mentioned/ characterized (as assessed at 24th hour).
Non pharmacological management of pain (NP)
If the patient gives affirmative response to questioning about whether the presence/action of caregivers effectively reduced their pain during any or whole of the previous 24 hrs, regardless of receipt of analgesic or not.
Documented/Not documented pain
Pain (or its absence) is mentioned/characterized /measured and documented on chart at 24th hour after admission.
Assessment of pain & management documented APMD
If pain is assessed, managed and documented at 24th hr after admission.
No Assessment of pain & management documented NAPMD
Neither assessed, managed and documented nor received analgesic at 24th hr after admission.
Incomplete Assessment & management documented IAPMD
Partially assessed/managed or documented at 24th hr after admission.
Pain Change
Degree of pain at 24th hr after admission compared to the patient’s own degree of pain at 8th hr.
Results
Study participants
From a total 195 admitted patients over 55 days, 161 (82.56%) patients who fulfilled he inclusion criteria were included in the study. The mean age (SD) was 49.89 (15.60) years. The age ranges 19&84 years. About 69 (42.8%) were females. The mean age (SD) of females and males was 42.99 (13.51) and 55.08 (15.10) years respectively. There was statistically significant difference in mean ages between females and males (t159 = -5.257, p=0.000). About 77 (47.82%) wee literate and there was statistically significant difference in mean ages between literates and illiterates (t159=- 7.074, p=0.000). Based on combined sex-literacy, one way ANOVA was significant and only mean age difference between illiterate females and literate males was not significant on multiple comparisons, as shown in (Table 1 and Figure 1).
| Sex | No. (%) | Median | Mean | SD | SEM | 95%CIM | Min. | Max. | t-test | |
| Female | 69(42.9) | 42 | 42.99 | 13.51 | 1.63 | 39.74 | 46.23 | 19 | 84 | t159=-5.257 |
| Male | 92(57.1) | 57 | 55.08 | 15.1 | 1.57 | 51.95 | 58.2 | 19 | 82 | p=0.000 |
| Total | 161(100.0) | 48 | 49.89 | 15.6 | 1.23 | 47.47 | 52.32 | 19 | 84 | |
| Literacy | No. (%) | Median | Mean | SD | SEM | 95%CIM | Min. | Max. | t-test | |
| Literate | 77(47.82) | 41 | 41.95 | 14.2 | 1.62 | 38.73 | 45.17 | 19 | 74 | t159=-7.074 |
| Illiterate | 84(52.17) | 56 | 57.18 | 13.12 | 1.43 | 54.33 | 60.03 | 32 | 84 | p=0.000 |
| Total | 161(100.0) | 48 | 49.89 | 15.6 | 1.23 | 47.47 | 52.32 | 19 | 84 | |
| Literacy-sex | No. (%) | Median | Mean | SD | SEM | 95%CIM | Min. | Max. | F-test | |
| Literate Females | 33(20.5) | 32 | 34.03 | 8.67 | 1.501 | 30.96 | 37.1 | 19 | 53 | F3,157=33.512 |
| Literate Males | 44(27.3) | 47.5 | 47.89 | 14.71 | 2.22 | 43.41 | 52.36 | 19 | 74 | p=0.000 |
| Illiterate Females | 36(22.4) | 51.5 | 51.19 | 11.87 | 1.98 | 47.18 | 55.21 | 32 | 84 | |
| Illiterate Males | 48(29.8) | 63.5 | 61.67 | 12.28 | 1.77 | 58.1 | 65.23 | 32 | 82 | |
| Total | 161(100.0) | 48 | 49.89 | 15.6 | 1.23 | 47.47 | 52.32 | 19 | 84 | |
Table 1: Showing Summary Statistics of age by sex, and literacy status, JUSH 2014.

Figure 1: Bar Graph Showing Distribution of Study Subjects By Age Group and Sex, JUSH, 2014.
About 29(18.01%) were aged 65 or above years. The female to male ratio within age group decreased with age from 2.50 at age group 15-24.9 to 0.20 at age group 75-84.9. And proportion of literates within age group decreases with increasing age from 100% at age group 15-24.9 to 0% at 75.0-84.9 year. There was no literate female above 53 years of age, as shown in (Table 2).
| Age (Years) |
Female | Male | Total | ||||
|---|---|---|---|---|---|---|---|
| Literate | Illiterate | Total females | Literate | Illiterate | Total males | ||
| 15-24.9 | 5 | 0 | 5 | 2 | 0 | 2 | 7 |
| 25-34.9 | 15 | 2 | 17 | 6 | 2 | 8 | 25 |
| 35-44.9 | 8 | 9 | 17 | 11 | 4 | 15 | 32 |
| 45-54.9 | 5 | 12 | 17 | 8 | 6 | 14 | 31 |
| 55-64.9 | 0 | 10 | 10 | 12 | 15 | 27 | 37 |
| 65-74.9 | 0 | 1 | 1 | 5 | 13 | 18 | 19 |
| 75-84.9 | 0 | 2 | 2 | 0 | 8 | 8 | 10 |
| Total | 33 | 36 | 69 | 44 | 48 | 92 | 161 |
Table 2: Showing frequency of cases by age-group, sex, and literacy status, JUSH 2014.
Chief complaint
The prevalence of patients with multiple, fever, cough and body swelling was 57 (35.4%), 27 (16.8%), 33 (20.5%), and 44 (27.3%) respectively. There was significant difference in mean age by chief complaint F3,157=5.526, p=0.001. On multiple comparisons, the mean age of those with BSW was significantly greater than those with fever, and multiple complaints. Among multiple complaints 29 (50.88%) were females. Among females, with multiple complaints half of were clustered in age group 19-34.9 years. Also, 30 (68.18%) of BSW were males 22 (73.33%) were aged 65 years or more years, as shown in (Tables 3-4).
| Chief Complaint | No. (%) | Median | Mean | SD | SEM | 95%CIM | Min. | Max. | F-test | |
|---|---|---|---|---|---|---|---|---|---|---|
| Multiple | 57(35.4) | 43 | 42.25 | 16.2 | 2.15 | 40.95 | 49.55 | 19 | 82 | F3,157=5.526, p=0.001 |
| Fever | 27(16.8) | 46 | 46.19 | 13.96 | 2.69 | 40.66 | 51.71 | 22 | 71 | |
| Cough | 33(20.5) | 52 | 52.06 | 13.26 | 2.31 | 47.36 | 56.76 | 26 | 74 | |
| BodySwelling | 44(27.3) | 60 | 56.57 | 15.1 | 2.23 | 51.98 | 61.16 | 22 | 84 | |
| Total | 161(100.0) | 48 | 49.89 | 15.6 | 1.23 | 47.47 | 52.32 | 19 | 84 | |
Table 3: Showing summary statistics of age by chief complaint, JUSH 2014.
| Age group |
Multiple | Fever | Cough | Body Swelling | Total | ||||||||||
|---|---|---|---|---|---|---|---|---|---|---|---|---|---|---|---|
| Females | Males | Total | Females | Males | Total | FFemales | Males | Total | Females | Males | Total | Females | Males | Total | |
| <35 | 15 | 4 | 19 | 4 | 3 | 7 | 1 | 1 | 2 | 2 | 2 | 4 | 22 | 10 | 32 |
| 35-44.9 | 6 | 5 | 11 | 4 | 1 | 5 | 3 | 6 | 9 | 4 | 3 | 7 | 17 | 15 | 32 |
| 45-54.9 | 7 | 3 | 10 | 4 | 3 | 7 | 2 | 5 | 7 | 4 | 3 | 7 | 17 | 14 | 31 |
| 55-64.9 | 1 | 9 | 10 | 2 | 4 | 6 | 5 | 4 | 9 | 2 | 10 | 12 | 10 | 27 | 37 |
| Ø65 | 0 | 7 | 7 | 1 | 1 | 2 | 0 | 6 | 6 | 2 | 12 | 14 | 3 | 26 | 29 |
| Total | 29 | 28 | 57 | 15 | 12 | 27 | 11 | 22 | 33 | 14 | 30 | 44 | 69 | 92 | 161 |
| Literate | 20 | 10 | 30 | 8 | 4 | 12 | 2 | 16 | 18 | 3 | 14 | 17 | 33 | 44 | 77 |
| Illiterate | 9 | 18 | 27 | 7 | 8 | 15 | 9 | 6 | 15 | 11 | 16 | 27 | 36 | 48 | 84 |
| Total | 29 | 28 | 57 | 15 | 12 | 27 | 11 | 22 | 33 | 14 | 30 | 44 | 69 | 92 | 161 |
Table 4: Showing frequency of cases by age group, chief complaint and sex, JUSH 2014.
Vital sign (Table 5) Occurrence of Pain Occurrence
| Vital Sign | Time | ||||
| At admission | 4th hour | 8th hour | 12th hour | 24th hour | |
| Temperature(°C) | |||||
| Low | 8(4.97) | 8(4.97) | 8(4.97) | 5(3.10) | 5(3.10) |
| Normal | 36(22.36) | 55(34.16) | 86(53.42) | 118(73.29) | 127(78.88) |
| High | 117(72.67) | 98(60.87) | 67(41.61) | 38(23.60) | 29(18.01) |
| Total | 161(100.0) | 161(100) | 161(100) | 161(100.0) | 161(100) |
| RR (no/min) | At admission | 4th hour | 8th hour | 12th hour | 24th hour |
| Low | 0 | 0 | 0 | 0 | 0 |
| Normal | 33(20.50) | 50(31.05) | 75(46.58) | 96(59.63) | 102(63.35) |
| High | 128(79.50) | 111(68.95) | 86(53.42) | 65(40.37) | 59(36.64) |
| Total | 161(100.0) | 161(100) | 161(100) | 161(100) | 161(100) |
| PR (no/min) | At admission | 4th hour | 8th hour | 12th hour | 24th hour |
| Low | 0 | 0 | 0 | 0 | 0 |
| Normal | 30(18.63) | 50(31.0) | 75(46.58) | 99(61.49) | 104(64.60) |
| High | 131(81.37) | 111(68.95) | 86(53.42) | 62(38.51) | 57(35.40) |
| Total | 161(100) | 161(100) | 161(100) | 161(100) | 161(100) |
Table 5: Showing the vital sign of patient, JUSH 2014.
About 147 (92.45) patients had experience of pain before admission. While 22 patients had severe pain before admission, only 4 at, and no patient with severe pain after admission (Tables 6-8).
| Period | Severity | No. | Median | Mean | SD | SEm | 95%CI | Min. | Max. | |
|---|---|---|---|---|---|---|---|---|---|---|
| Before admission | No | 12 | 50.00 | 52.50 | 17.66 | 5.10 | 41.28 | 63.72 | 26 | 84 |
| Mild | 45 | 52.00 | 52.62 | 15.22 | 2.27 | 48.05 | 57.20 | 24 | 78 | |
| Moderate | 80 | 47.00 | 49.00 | 15.74 | 1.76 | 45.00 | 52.50 | 19 | 82 | |
| Severe | 22 | 49.00 | 46.59 | 15.21 | 3.24 | 39.85 | 53.33 | 22 | 69 | |
| Other* | 2 | - | - | - | - | - | - | 38 | 52 | |
| Total | 161 | 48.00 | 49.89 | 15.60 | 1.24 | 47.47 | 52.32 | 19 | 84 | |
| At admission | No | 13 | 52.00 | 53.31 | 17.12 | 4.76 | 42.94 | 63.68 | 26 | 84 |
| Mild | 54 | 51.50 | 51.07 | 15.40 | 2.09 | 46.87 | 55.28 | 19 | 78 | |
| Moderate | 88 | 47.00 | 48.41 | 15.67 | 1.67 | 45.09 | 51.73 | 19 | 82 | |
| Severe | 4 | 59.00 | 35.01 | 14.44 | 7.22 | 35.01 | 80.99 | 39 | 74 | |
| Other* | 2 | - | - | - | - | - | - | 38 | 52 | |
| Total | 159 | 48.00 | 49.89 | 15.60 | 1.24 | 47.47 | 52.32 | 19 | 84 | |
| After admission | No | 18* | 47.50 | 50.39 | 15.94 | 3.76 | 42.46 | 58.32 | 26 | 84 |
| Mild | 113 | 51.00 | 49.70 | 15.82 | 1.49 | 46.75 | 52.65 | 19 | 82 | |
| Moderate | 29 | 49.00 | 50.76 | 15.10 | 2.80 | 45.01 | 56.50 | 27 | 79 | |
| Severe | 0 | - | - | - | - | - | - | - | - | |
| Other* | 1 | - | - | - | - | - | - | 38 | 38 | |
| Total | 161 | 48.00 | 49.89 | 15.60 | 1.24 | 47.47 | 52.32 | 19 | 84 | |
Table 6: Showing summary statistics of age by period and degree of severity of pain, JUSH 2014.
| Type of Pain before admission | No. (%) | Median | Mean | SD | SEM | 95%CIM | Min. | Max. | |
|---|---|---|---|---|---|---|---|---|---|
| No Pain/record | 13(8.12) | 52.00 | 53.15 | 17.70 | 4.91 | 42.46 | 63.85 | 26 | 84 |
| Continuous | 84(52.50) | 46.00 | 47.89 | 16.88 | 1.84 | 44.23 | 51.56 | 19 | 82 |
| Intermittent | 63(39.37) | 53.00 | 51.71 | 13.14 | 1.65 | 48.41 | 55.02 | 22 | 76 |
| Total | 160(100.0) | 48.00 | 49.89 | 15.60 | 1.23 | 47.47 | 52.32 | 19 | 84 |
Table 7: Showing summary statistics of type of pain before admission by age group, JUSH 2014.
| Severity of Pain | ||||||||||||||||||||||||
| Before Admission | At Admission | After Admission | ||||||||||||||||||||||
| No. | Mild | Moderate | Severe | Total | No. | Mild | Moderate | Severe | Total | No. | Mild | Moderate | Severe | Total | ||||||||||
| <35 | 2 | 7 | 16 | 7 | 32 | 2 | 8 | 22 | 0 | 32 | 3 | 23 | 6 | 0 | 32 | |||||||||
| 35-44.9 | 2 | 9 | 18 | 2 | 31 | 2 | 12 | 16 | 1 | 31 | 3 | 24 | 4 | 0 | 31 | |||||||||
| 45-54.9 | 3 | 8 | 15 | 4 | 30 | 3 | 12 | 15 | 0 | 30 | 6 | 18 | 7 | 0 | 31 | |||||||||
| 55-64.9 | 2 | 10 | 19 | 6 | 37 | 3 | 12 | 20 | 2 | 37 | 2 | 29 | 6 | 0 | 37 | |||||||||
| ≥65 | 3 | 11 | 12 | 3 | 29 | 3 | 10 | 15 | 1 | 29 | 4 | 19 | 6 | 0 | 29 | |||||||||
| Total | 12 | 45 | 80 | 22 | 159 | 13 | 54 | 88 | 4 | 160 | 18 | 113 | 29 | 0 | 160 | |||||||||
| Literacy | Before Admission | At Admission | After Admission | |||||||||||||||||||||
| Lit-F | 0 | 10 | 16 | 7 | 33 | 0 | 8 | 25 | 0 | 33 | 1 | 26 | 6 | 0 | 33 | |||||||||
| Ill-F | 6 | 9 | 19 | 1 | 35 | 6 | 12 | 17 | 0 | 35 | 8 | 25 | 2 | 0 | 35 | |||||||||
| L-M | 5 | 12 | 19 | 8 | 44 | 5 | 15 | 22 | 2 | 44 | 6 | 27 | 11 | 0 | 44 | |||||||||
| I-M | 1 | 14 | 26 | 6 | 47 | 2 | 19 | 24 | 2 | 47 | 3 | 35 | 10 | 0 | 48 | |||||||||
| Total | 12 | 45 | 80 | 22 | 159 | 13 | 54 | 88 | 4 | 159 | 18 | 113 | 29 | 0 | 160 | |||||||||
Table 8: Showing frequency by age group, period, and degree of severity of pain, JUSH 2014.
Pain-triggering conditions during before admission
Pain triggering conditions during before admission as reported by patients were: physical activity 101(68.24%), and cough 3(2.03%), while 44(29.73%) were unknown.
Effect of the pain during before admission
The effect of the pain that occurred before admission was said to be on sleep, physical activity, mood, and other in 71(44.94), 43(27.21), 23(14.56), and 9(5.70) of all patients respectively, as shown in (Tables 9-15).
| Effect or Pain | No. (%) | Median | Mean | SD | SEM | 95%CIM | Min | Max | |
|---|---|---|---|---|---|---|---|---|---|
| Sleep | 71(44.94) | 47.00 | 48.75 | 16.074 | 1.908 | 44.94 | 52.55 | 19 | 79 |
| Physical activity | 43(27.21) | 53.00 | 53.86 | 13.394 | 2.043 | 49.74 | 57.98 | 29 | 82 |
| Mood | 23(14.56) | 40.00 | 42.91 | 15.562 | 3.245 | 36.18 | 49.64 | 22 | 74 |
| Other | 9(5.70) | 55.00 | 48.11 | 12.840 | 4.280 | 38.24 | 57.98 | 28 | 63 |
| No Pain | 12(7.59) | 57.00 | 54.67 | 17.583 | 5.076 | 43.50 | 65.84 | 26 | 84 |
| Total | 158(100) | 48.00 | 49.70 | 15.528 | 1.235 | 47.26 | 52.14 | 19 | 84 |
Table 9: Showing summary statistics by effect of the pain during before admission, JUSH 2014.
| Effect of the pain Before admission |
Degree of the pain before admission | ||||
|---|---|---|---|---|---|
| Mild | Moderate | Severe | No | Total | |
| Sleep | 19 | 35 | 16 | 0 | 70 |
| Physical Activity | 15 | 23 | 5 | 0 | 43 |
| Mood | 6 | 14 | 1 | 1 | 22 |
| Other | 4 | 5 | 0 | 0 | 9 |
| No | 0 | 1 | 0 | 11 | 12 |
| Total | 44 | 78 | 22 | 12 | 156 |
Table 10: Showing frequency of cases by effect of pain during before admission and severity, JUSH 2014.
| Effect and/or Pain before admission |
ChiefComplaint at OPD |
Age group(in years) | |||||
|---|---|---|---|---|---|---|---|
| ≤34.9 | 35-44.9 | 45-54.9 | 55-64.9 | ≥65.0 | Total | ||
| Sleep | Multiple | 9 | 7 | 8 | 2 | 3 | 29 |
| Fever | 1 | 2 | 1 | 2 | 0 | 6 | |
| Cough | 1 | 5 | 4 | 4 | 5 | 19 | |
| Body Swelling | 4 | 1 | 2 | 6 | 4 | 17 | |
| Total | 15 | 15 | 15 | 14 | 12 | 71 | |
| Physical activity | Multiple | 2 | 4 | 1 | 4 | 3 | 14 |
| Fever | 0 | 1 | 3 | 3 | 2 | 9 | |
| Cough | 0 | 2 | 1 | 3 | 0 | 6 | |
| Body Swelling | 0 | 5 | 3 | 2 | 4 | 14 | |
| Total | 2 | 12 | 8 | 12 | 9 | 43 | |
| Mood | Multiple | 7 | 0 | 1 | 3 | 0 | 11 |
| Fever | 4 | 0 | 2 | 0 | 0 | 6 | |
| Cough | 0 | 1 | 0 | 1 | 1 | 3 | |
| Body Swelling | 0 | 1 | 1 | 0 | 1 | 3 | |
| Total | 11 | 2 | 4 | 4 | 2 | 23 | |
| Other | Multiple | 1 | 0 | 0 | 1 | 0 | 2 |
| Fever | 1 | 0 | 1 | 1 | 0 | 3 | |
| Cough | 0 | 1 | 0 | 1 | 0 | 2 | |
| Body Swelling | 0 | 0 | 0 | 2 | 0 | 2 | |
| Total | 2 | 1 | 1 | 5 | 0 | 9 | |
| No Pain | Multiple | 0 | 0 | 0 | 0 | 1 | 1 |
| Fever | 1 | 2 | 0 | 0 | 0 | 3 | |
| Cough | 1 | 0 | 2 | 0 | 0 | 3 | |
| Body Swelling | 0 | 0 | 1 | 2 | 3 | 6 | |
| Total | 2 | 2 | 3 | 2 | 4 | 13 | |
| Total | 32 | 32 | 31 | 37 | 27 | 159 | |
Table 11: Showing frequency of cases by effect of pain during before admission, chief complaint and age group, JUSH 2014.
| Worst Degree of Pain felt at |
No. (%) | Median | Mean | SD | SEM | 95%CIM | Min. | Max. | |
|---|---|---|---|---|---|---|---|---|---|
| Lower | Upper | ||||||||
| Before admission | 80(49.69) | 52.00 | 51.05 | 16.261 | 1.818 | 47.43 | 54.67 | 19 | 82 |
| At admission | 51(31.68) | 45.00 | 47.49 | 15.119 | 2.117 | 43.24 | 51.74 | 22 | 76 |
| After admission | 7(4.35) | 47.00 | 50.00 | 16.723 | 6.321 | 34.53 | 65.47 | 28 | 74 |
| Other* | 23(14.28) | 52.00 | 51.17 | 14.285 | 2.979 | 45.00 | 57.35 | 26 | 84 |
| Total | 161(100.00) | 48.00 | 49.89 | 15.598 | 1.229 | 47.47 | 52.32 | 19 | 84 |
Table 12: Showing summary statistics of age by worst intensity felt, JUSH 2014.
| Age Group | Worst Degree of Pain felt at | ||||
|---|---|---|---|---|---|
| Before admission | At admission | After admission | Other* | Total | |
| <35 | 17 | 12 | 1 | 2 | 32 |
| 35-44.9 | 10 | 13 | 2 | 7 | 32 |
| 45-54.9 | 17 | 7 | 2 | 5 | 31 |
| 55-64.9 | 20 | 12 | 0 | 5 | 37 |
| ≥65 | 16 | 7 | 2 | 4 | 29 |
| Total | 80 | 51 | 7 | 23 | 161 |
Table 13: Showing frequency of cases by age group and duration of worst intensity of pain felt, JUSH 2014.
| FPS | Patient Response | |||||
| Sequence* | Worst | Worst degree of pain felt during (response by patient questioned after 4th hr.) | ||||
| A | Before | Before admission | At admission | After admission | Other | Total |
| MOMIMI | 29 | 25 | 2 | 0 | 2 | 29 |
| SEMOMO | 12 | 12 | 0 | 0 | 0 | 12 |
| SEMOMI | 8 | 8 | 0 | 0 | 0 | 8 |
| MOMINO | 3 | 1 | 0 | 0 | 2 | 3 |
| SEMIMI | 2 | 1 | 0 | 1 | 1 | 2 |
| Total | 54 | 47 | 2 | 1 | 5 | 54 |
| B | Same | Before admission | At admission | After admission | Other | Total |
| MIMIMI | 20 | 13 | 6 | 0 | 1 | 20 |
| MOMOMO | 11 | 6 | 1 | 3 | 1 | 11 |
| Total | 31 | 19 | 7 | 3 | 2 | 31 |
| C | Before or at | Before admission | At admission | After admission | Other | Total |
| MOMOMI | 30 | 11 | 17 | 0 | 2 | 30 |
| MOMONO | 3 | 2 | 1 | 0 | 0 | 3 |
| Total | 33 | 13 | 18 | 0 | 2 | 33 |
| D | At admission | Before admission | At admission | After admission | Other | Total |
| MIMOMI | 19 | 1 | 18 | 0 | 0 | 19 |
| MOSEMI | 3 | 0 | 3 | 0 | 0 | 3 |
| MIMONO | 1 | 0 | 0 | 1 | 0 | 1 |
| MOSEMO | 1 | 0 | 1 | 0 | 0 | 1 |
| Total | 24 | 1 | 22 | 1 | 0 | 24 |
| E | No pain before-at-after | Before admission | At admission | After admission | Other | |
| NONONO | 11 | 0 | 0 | 0 | 11 | 11 |
| F | At or after | Before admission | At admission | After admission | Other | Total |
| MIMOMO | 4 | 0 | 1 | 2 | 1 | 4 |
| G | Before/ after | Before admission | At admission | After admission | Other | |
| MINOMI | 1 | 0 | 1 | 0 | 0 | 1 |
| H | After | Before admission | At admission | After admission | Other | |
| NONOMI | 1 | 0 | 0 | 1 | 0 | 1 |
| I | Before and at not measured | Before admission | At admission | After admission | Other | |
| VVMO | 1 | 0 | 0 | 0 | 1 | 1 |
| J | Before-at-after unmeasured | Before admission | At admission | After admission | Other | |
| VVV | 1 | 0 | 0 | 0 | 0 | 1 |
| Total | 161 | 80 | 51 | 7 | 23 | 161 |
Table 14: Showing Comparison of Worst Degree of Pain Felt Using FPS vs. Patient Response, JUSH 2014.
| Variable | FPS | |||||||||||
| A | B | C | D | E | F | G | H | I | J | Total | ||
| Age | <35 | 12 | 7 | 8 | 3 | 2 | 0 | 0 | 0 | 0 | 0 | 32 |
| 35-44.9 | 11 | 7 | 6 | 4 | 1 | 1 | 0 | 1 | 0 | 1 | 32 | |
| 45-54.9 | 11 | 7 | 5 | 4 | 3 | 0 | 0 | 0 | 1 | 0 | 31 | |
| 55-64.9 | 16 | 4 | 5 | 8 | 2 | 1 | 1 | 0 | 0 | 0 | 37 | |
| >65 | 8 | 6 | 5 | 5 | 3 | 2 | 0 | 0 | 0 | 0 | 29 | |
| Total | 58 | 31 | 29 | 24 | 11 | 4 | 1 | 1 | 1 | 1 | 161 | |
| Sex-education | Literate Female | 11 | 7 | 9 | 5 | 0 | 1 | 0 | 0 | 0 | 0 | 33 |
| Illiterate Females | 11 | 5 | 7 | 6 | 6 | 0 | 0 | 0 | 0 | 1 | 36 | |
| Literate Male | 18 | 10 | 3 | 6 | 4 | 2 | 0 | 1 | 0 | 0 | 44 | |
| Illiterate Males | 18 | 9 | 10 | 7 | 1 | 1 | 1 | 0 | 1 | 0 | 48 | |
| Total | 58 | 31 | 29 | 24 | 11 | 4 | 1 | 1 | 1 | 1 | 161 | |
| CC | Multiple | 21 | 11 | 15 | 7 | 0 | 1 | 1 | 0 | 0 | 1 | 57 |
| BSW | 16 | 8 | 6 | 6 | 6 | 1 | 0 | 0 | 1 | 0 | 44 | |
| Cough | 13 | 7 | 3 | 4 | 3 | 2 | 0 | 1 | 0 | 0 | 33 | |
| Fever | 8 | 5 | 5 | 7 | 2 | 0 | 0 | 0 | 0 | 0 | 27 | |
| Total | 58 | 31 | 29 | 24 | 11 | 4 | 1 | 1 | 1 | 1 | 161 | |
| Type ofpain | Continuous | 29 | 17 | 20 | 13 | 0 | 4 | 0 | 0 | 0 | 1 | 84 |
| Intermittent | 27 | 14 | 9 | 10 | 0 | 0 | 1 | 1 | 1 | 0 | 63 | |
| No | 2 | 0 | 0 | 0 | 11 | 0 | 0 | 0 | 0 | 0 | 13 | |
| Total | 58 | 31 | 29 | 23 | 11 | 4 | 1 | 1 | 1 | 1 | 161 | |
| Effect | Sleep | 34 | 12 | 12 | 10 | 0 | 2 | 0 | 0 | 0 | 1 | 71 |
| PHA | 15 | 12 | 8 | 8 | 0 | 0 | 0 | 0 | 0 | 0 | 43 | |
| Mood | 6 | 4 | 6 | 3 | 0 | 2 | 0 | 1 | 1 | 0 | 23 | |
| Other | 2 | 1 | 2 | 3 | 0 | 0 | 1 | 0 | 0 | 0 | 9 | |
| NA | 1 | 0 | 0 | 0 | 11 | 0 | 0 | 0 | 0 | 0 | 12 | |
| Total | 58 | 29 | 28 | 24 | 11 | 4 | 1 | 1 | 1 | 1 | 158 | |
Table 15: Showing Frequency of Worst Degree of Pain Felt Using FPS by Social variables JUSH, 2014.
Pain aggravating conditions at 8th hr
Also, (at 8th hour after their admission) sites of IV line, IV medication, IM, LP, ID catheter were mentioned as their pain aggravating conditions (and here the pain is localized type), as shown in (Table 16).
| Pain aggravating | Degree of Pain at 8th hour | ||||||||
| 0 | 1-3 | 4-7 | 8-10 | Total | |||||
| IV/IVL/IM | 0 | 32 | 85 | 44 | 161 | ||||
| Catheter | 0 | 5 | 5 | 0 | 10 | ||||
| LP/ID | 0 | 0 | 1 | 3 | 4 | ||||
| Total | 0 | 32 | 85 | 44 | 161 | ||||
| Period | Degree of Pain | ||||||||
| No | Mild | Moderate | Severe | Total | |||||
| Before | 12 | 45 | 80 | 22 | 159 | ||||
| At | 13 | 54 | 88 | 4 | 159 | ||||
| After | 18 | 113 | 29 | 0 | 160 | ||||
| 8th hour | 0 | 32 | 85 | 44 | 161 | ||||
| At 24th hour | 21 | 113 | 28 | 1 | 161 | ||||
Table 16: Showing the frequency of pain aggravating conditions, JUSH 2014.
Chart Evaluation at 24th Hr after Admission at 24th hr (Tables 17-21).
| Patients receive analgesic? | Documentation of assessment/management | ||
|---|---|---|---|
| APMD | NAPMD | Total | |
| RPM | 43 | 6 | 49 |
| Not RPM | 12 | 100 | 112 |
| Total | 55 | 106 | 161 |
Table 17: Showing frequency of charts’ documentation of pain assessment/ medication by receipt of pain medication, JUSH 2014.
| Variables | No. | Median | Mean | SD | SEM | 95%CIM | Min | Max | Test | |
|---|---|---|---|---|---|---|---|---|---|---|
| Both APMD and RPM | 43 | 43.00 | 44.02 | 14.74 | 2.25 | 39.49 | 48.56 | 19 | 71 | t141=-3.013 p=0.003 |
| Neither APMD nor RPM | 100 | 52.50 | 52.55 | 15.84 | 1.58 | 49.41 | 55.69 | 19 | 84 | |
| Total | 143 | 49.00 | 49.99 | 15.95 | 1.33 | 47.35 | 52.62 | 19 | 84 | |
| RPM | 49 | 45.00 | 44.71 | 14.64 | 2.09 | 40.51 | 48.92 | 19 | 71 | t141=-8.257 p=0.003 |
| Not RPM | 112 | 52.00 | 52.16 | 15.52 | 1.47 | 49.25 | 55.07 | 19 | 84 | |
| Total | 161 | 48.00 | 49.89 | 15.60 | 1.23 | 47.47 | 52.32 | 19 | 84 | |
| No APMD but RPM | 6 | 49.50 | 49.67 | 14.12 | 5.77 | 34.85 | 64.49 | 28 | 66 | t16=0.114 p=0.911 |
| APMD but not RPM | 12 | 44.00 | 48.92 | 12.70 | 3.67 | 40.85 | 56.99 | 32 | 75 | |
| Total | 18 | 45.00 | 49.17 | 12.77 | 3.01 | 42.81 | 55.52 | 28 | 75 | |
| APMD | 56 | 44.00 | 45.23 | 14.26 | 1.90 | 41.41 | 49.05 | 19 | 75 | t159=2.830 p=0.005 |
| No APMD | 105 | 52.00 | 52.38 | 15.77 | 1.54 | 49.33 | 55.43 | 19 | 84 | |
| Total | 161 | 48.00 | 49.89 | 15.60 | 1.23 | 47.47 | 52.32 | 19 | 84 | |
Table 18: Showing summary statistics of age by receipt of medication and assessment/documentation of pain, JUSH 2014.
| Assessment | Charts Reviewed | |||||
|---|---|---|---|---|---|---|
| Issue | Number of Patients | Both APMD and RPM | No RPM but APMD | RPM but no APMD | Neither APMD nor RPM | Total |
| N=161 | n=43 | n=12 | n=6 | n=100 | N=161 | |
| 1. Occurrence of pain | 159 | 43 | 12 | 6 | 100 | 161 |
| 2. Measurement of pain | ||||||
| • Use of scale | 159 | 0 | 0 | 0 | 0 | 0 |
| 3. Characterization of Pain | ||||||
| • Pain onset | ||||||
| Before | 127 | 25 | 4 | 0 | 0 | 29 |
| At | 18 | 18 | 8 | 0 | 0 | 26 |
| After | 3 | 0 | 0 | 0 | 0 | 0 |
| Total | 148 | 43 | 12 | 0 | 0 | 55 |
| • Type of pain | ||||||
| Continuous | 84 | 20 | 0 | 0 | 0 | 20 |
| Intermittent | 63 | 23 | 0 | 0 | 0 | 23 |
| Total | 147 | 43 | 0 | 0 | 0 | 43 |
| Worst degree of pain felt | ||||||
| Before | 80 | 0 | 0 | 0 | 0 | 0 |
| At | 51 | 0 | 0 | 0 | 0 | 0 |
| After | 7 | 0 | 0 | 0 | 0 | 0 |
| Total | 138 | 0 | 0 | 0 | 0 | 0 |
| • Aggravating factors | ||||||
| IV/IVL/IM | 161 | 0 | 0 | 0 | 0 | 0 |
| Catheter | 10 | 0 | 0 | 0 | 0 | 0 |
| LP/ID | 4 | 0 | 0 | 0 | 0 | 0 |
| Total | 161 | 0 | 0 | 0 | 0 | 0 |
| • Effect of pain | ||||||
| Sleep | 71 | 0 | 0 | 0 | 0 | 0 |
| Physical activity | 43 | 0 | 0 | 0 | 0 | 0 |
| Mood | 23 | 0 | 0 | 0 | 0 | 0 |
| Other | 9 | 0 | 0 | 0 | 0 | 0 |
| No | 12 | 0 | 0 | 0 | 0 | 0 |
| Total | 0 | 0 | 0 | 0 | 0 | |
Table 19: Showing Comparison of Patient Assessment and Chart Findings, JUSH 2014.
| 4. Management of pain | Both APMD+RPM N=43 | No RPM but APMD N=12 |
RPM but no APMD N=6 |
Neither APMD nor RPM N=100 |
Total N=161 |
|||
|---|---|---|---|---|---|---|---|---|
| Regular | Irregular | Total | ||||||
| BID | TID Total | |||||||
| A. Analgesic | ||||||||
| Diclofenac | 5 | 27 | 14 | 21 | 9 | 0 | 0 | 30 |
| Paracetamol | 0 | 88 | 10 | 18 | 3 | 0 | 0 | 21 |
| Multiple analgesics | 0 | 22 | 2 | 4 | 0 | 0 | 0 | 4 |
| Tramadol | 0 | 00 | 1 | 1 | 0 | 0 | 0 | 1 |
| Total | 5 | 1217 | 27 | 44 | 12 | 0 | 0 | 56 |
| B. Route | Regular | Irregular | Total | |||||
| BIDTIDTotal | ||||||||
| IV | 314 | 7 | 11 | 6 | 0 | 0 | 17 | |
| Oral | 088 | 10 | 18 | 3 | 0 | 0 | 21 | |
| IM | 213 | 9 | 12 | 3 | 0 | 0 | 15 | |
| Multiple | 022 | 1 | 3 | 0 | 0 | 0 | 3 | |
| Total | 51217 | 27 | 44 | 12 | 0 | 0 | 56 | |
| C. Frequency of order/patient/24hr | Regular | Irregular | Total | 0 | ||||
| 1x | - | 1 | 1 | 8 | 0 | 0 | 9 | |
| 2x | - | 9 | 9 | 3 | 0 | 0 | 12 | |
| 3x | - | 11 | 11 | 1 | 0 | 0 | 12 | |
| Total | - | 21 | 21 | 12 | 0 | 0 | 33 | |
| D. Pre procedure analgesic | Regular | Irregular | Total | 0 | ||||
| Yes | 2 | 0 | 2 | |||||
| E.NP/PM | l | |||||||
| NP | BothAPMD and RPM | No RPM but APMD | RPM but no APMD | NeitherAPMDnor RPM | Total | |||
| Yes | 23 | 6 | 3 | 4 | 36 | |||
| No | 20 | 6 | 3 | 96 | 125 | |||
| Total | 43 | 12 | 6 | 100 | 161 | |||
Table 20: Showing Comparison of Information about Patient Management from Chart vs. from Patients, JUSH 2014.
| Variable | FPS | |||||||||||
|---|---|---|---|---|---|---|---|---|---|---|---|---|
| A | B | C | D | E | F | G | H | I | J | Total | ||
| PM and Document | Neither APMD nor RPM | 39 | 18 | 13 | 13 | 11 | 3 | 1 | 1 | 1 | 0 | 100 |
| Both APMD and RPM | 16 | 8 | 9 | 10 | 0 | 0 | 0 | 0 | 0 | 0 | 43 | |
| APMD but not RPM | 2 | 3 | 5 | 1 | 0 | 0 | 0 | 0 | 0 | 1 | 12 | |
| No APMD but RPM | 1 | 2 | 2 | 0 | 0 | 1 | 0 | 0 | 0 | 0 | 6 | |
| Total | 58 | 31 | 29 | 24 | 11 | 4 | 1 | 1 | 1 | 1 | 161 | |
| NP | No | 46 | 22 | 23 | 17 | 11 | 4 | 1 | 0 | 1 | 0 | 125 |
| Yes | 12 | 9 | 6 | 7 | 0 | 0 | 0 | 1 | 0 | 1 | 36 | |
| Total | 58 | 31 | 29 | 24 | 11 | 4 | 1 | 1 | 1 | 1 | 161 | |
Table 21: Showing Comparison of Information about Patient Management from Chart vs. from Patients, JUSH 2014.
Discussion
Over 55 days, at the assessment of pain using FPS showed all patients experienced pain during before and the first 24 hrs.
Pain before admission was said to be triggered by physical activity 101 (68.24%), cough 3 (2.03%), while 44 (29.73%) could not remember/would not. Also, effect of pain was said to be on sleep/ inability to fall asleep, physical activity/inability to work, mood/ lowered state, and other/appetite, as recalled by 71 (44.94%), 43 (27.21%), 23 (14.56%) and 9 (5.70%) of patients. Thus we note physical activity as pain precipitating event or as restrictive condition/effect of pain. Similarly, cough as pain precipitating condition or chief complaint. Cough can also present as chief complaint without pain.
The worst degree of pain felt (from among before, at, after) by patients also agree with a highest degree of pain as indicated by FPS. However, patients had difficulty of choice for example when pain before and at admission were both moderate. The worst degree of pain felt depends on the current degree of pain which in turn may be the result of interventions.
Also, (at 8th hr after their admission) sites of IV line, IV medication, IM, LP, ID catheter were mentioned as their pain aggravating conditions (and here the pain is localized type), even though these were actually the means of investigation or treatment (including pain) or follow up by the practicing physician. These actions must be in such a way to minimize the pain.
About 43 patients had their assessment/ management documented as well as the patients received analgesics implied their respective chart. The contents of the documents showed: absence of recording about of time of assessment, time of analgesic order, and schedule and route of analgesic administration, the expression of degree of pain being subjective without rating or scoring the degree of pain (not measured using FPS), and conditions under which the analgesics were ordered that is mostly irregular and upon patients request. Together, these point to unguided assessment and management of pain during the first 24 hours. This also made difficult to know whether the measure of severity of pain after admission was affected by drug or not.
In 100 charts, neither assessment/management documented nor the respective patients receive analgesics even though all had various degree of pain which show absence of intervention at least during the first 24 hrs. This shows unrecognized/ill recognized pain.
Twelve charts contained documentation of assessment and management. Yet the patients did not receive analgesic at 24th hour after admission. Six charts contained no documentation of assessment and management. Nevertheless, the patients had analgesics at their disposal. We learned that they requested prescription and procured them.
In all charts there was no mention about NP. In this study, the assessment of NP was solely based on the patient’s own belief (affirmation or rejection) of the idea about whether his/her caregiver/relatives’ presence and/or behavior effectively resulted in reduction of his/her pain during the previous 24 hrs. It must be clear that all patients had caregivers/relatives, all were asked the same question and disregarding whether the patient received analgesic or not. The challenge in this respect was the existence, definition ad meaning of NP, the role of caregivers in bringing the patients, as negotiators with health worker in securing prescription/analgesic/purchase analgesic.
Noting teaching of large number staff, and Specific guidelines for pain management were designed for JUSH and introduced to all surgical wards, ICU and to the nursing staff, interns and residents running these areas during 2012, the feedback given by trainees (4), and the state of practice of pain management at various sections (3,4,6) and teaching (7). We appreciate the efforts made by A VISITING LECTURER PROGRAMME (5) that it was timely. Thanks to all who contributed to this work. The authors failed to find any evidence as to whether there was subsequent change in management practice at surgical ward, and whether the experience was adopted and expanded to other areas like medical ward. Our study shows this was unlikely, but there is a lesson that must be learnt.
Conclusion
In medical ward, pain assessment and management lacked measurement using scale, sustained follow up and documentation
Majority of patients felt the worst degree of pain before and/or at admission.
While FPS were appropriate for illiterate, literate and result of worst degree of pain felt according to FPS agreed with worst degree of pain felt by patient like difficulty answering worst degree of pain felt in particular situations (for example, pain before, at and after admission were all moderate based on FPS) was observed.
Emergent pain due to procedures on sites of IV line /IM/ catheter / LP/ID constituted most emergent pain and affects nearly all patients.
Changes in pain severity where not tracked, emergent pains were undetected.
Majority of patients with pain were unmanaged and considerably proportion where treated with unguided management.
Recommendation
Introduction of standard assessment and management of guideline
Training of health workers based on guidelines
Implementation and subsequent evaluation of outcomes of pain management
Procedures on sites of IV line /IM/ catheter /LP/ID must be done optimally to minimize the consequent pain
Further research on format of tool
Strengths and weaknesses of the study
Health workers (data collectors were free from their routine work)
Information was gathered independently and from multiple sources
Assessment of NP is open for question
Assessment of pain without treating pain-ethical concern
Information on vital sign was not utilized-ethical concern
Acknowledgements
We like to thank CPHMS for supporting this research. We are also grateful to all patients who were willing to be included in this study.
Facial verbal and numeric pain rating scale
References
- Adapted from Management of Cancer Pain, Clinical Guideline Number 9. AHCPR.pp:94-0592.
- Agency for Healthcare Research & Quality(1994) Rockville.
- STANDARD TREATMENT GUIDELINE FOR PRIMARY HOSPITALS(2010) Drug Administration and Control Authority of Ethiopia.
- J Res Pharm Pract(2014)pp:1-5. doi: 10.4103/2279-042X.132702.
- Postoperative Pain Management among Surgically Treated Patients in an Ethiopian Hospital. Tewodros Eyob Woldehaimanot, Tesfahun Chanie,Eshetie, Mirkuzie Woldie Kerie. AAGBI International Relations Committee Travel Grant. Report: November 2012.
- QUALITY USE OF ANALGESICS IN A DENTAL CLINIC IN JIMMA UNIVERSITY HOSPITAL, ETHIOPIA. Tekalign Admasu, Hiwot Ambachew, Tirsit Retta, Million Tesfaye, Tewodros Eyob, Jimma University, Ethiopi.
- Knowledge and Attitude towards Pain Management among Medical and Paramedical students of an Ethiopian University (2013).Eyob e.t.al, J Pain Relief, https://dx.doi.org/10.4172/2167-0846.1000127 Abstract
- JOB SATISFACTION AND ITS DETERMINANTS AMONG HEALTH WORKERS IN JIMMA UNIVERSITY SPECIALIZED HOSPITAL, SOUTHWEST ETHIOPIA.
Open Access Journals
- Aquaculture & Veterinary Science
- Chemistry & Chemical Sciences
- Clinical Sciences
- Engineering
- General Science
- Genetics & Molecular Biology
- Health Care & Nursing
- Immunology & Microbiology
- Materials Science
- Mathematics & Physics
- Medical Sciences
- Neurology & Psychiatry
- Oncology & Cancer Science
- Pharmaceutical Sciences